Map-Reduce Ingest of GDELT
This tutorial shows how to:
- Ingest big GDELT data files into a GeoMesa Accumulo table via a Hadoop Map/Reduce job.
- Leverage GeoServer to query and visualize the data.
Prerequisites
Warning
You will need access to a Hadoop 2.2 or better installation as well as an Accumulo 1.7 or 1.8 database.
You will also need:
- access to an Accumulo user that has both create-table and write permissions,
- an instance of GeoServer 2.9.1 with the GeoMesa plugin installed,
- Java JDK 8,
- Apache Maven 3.2.2 or better, and
- a git client.
Obtaining GDELT data
The GDELT Event database provides a
comprehensive time- and location-indexed archive of events reported in
broadcast, print, and web news media worldwide from 1979 to today. You
can download raw GDELT data files at
http://data.gdeltproject.org/events/index.html. For example, the
following Bash commands use wget to download all event files for
2013 and 2014 (5 GB compressed, 30 GB uncompressed) and md5sum to
verify each by their MD5 hash:
$ mkdir gdelt && cd gdelt
$ wget http://data.gdeltproject.org/events/md5sums
$ for file in `cat md5sums | cut -d' ' -f3 | grep '^201[34]'` ; do wget http://data.gdeltproject.org/events/$file ; done
$ md5sum -c md5sums 2>&1 | grep '^201[34]'
Note: the whole GDELT data set is very large, over 100 GB compressed and
over 1 TB uncompressed. We download all data for 2013-2014 as we look at
events in the Ukraine in this time period in the ANALYZE section
below. However, you may load a smaller dataset for demonstration
purposes; data for a typical month is about ~2 GB uncompressed, but you
will see fewer data in the analysis below. In any case, omit the
aggregated, reduced GDELT data in
GDELT.MASTERREDUCEDV2.1979-2013.zip, which has fewer columns than
the fully-described event data in the other files, and is not supported
by the ingest code described below.
In the directory with the *.zip data files, use the following
command to unpack and aggregate them into a file called gdelt.tsv on
the Hadoop file system:
$ (ls -1 *.zip | xargs -n 1 zcat) | hadoop fs -put - /gdelt/uncompressed/gdelt.tsv
Note: the individual files, when uncompressed, have *.csv
extensions, but the data contained within them are tab-separated values,
hence the *.tsv extension. See the GDELT raw data file
documentation
for more information on the format of these files.
Download and Build the Tutorial
Pick a reasonable directory on your machine, and run:
$ git clone https://github.com/geomesa/geomesa-tutorials.git
$ cd geomesa-tutorials
Note
You may need to download a particular release of the tutorials project to target a particular GeoMesa release. See About Tutorial Versions.
To build, run
$ mvn clean install -pl geomesa-examples-gdelt
Note
Ensure that the version of Accumulo, Hadoop, etc in
the root pom.xml match your environment.
Note
Depending on the version, you may also need to build GeoMesa locally. Instructions can be found under Installation.
Running the Ingest
Use hadoop jar to launch the Map/Reduce ingest job:
$ hadoop jar geomesa-examples-gdelt/target/geomesa-examples-gdelt-<version>.jar \
    com.example.geomesa.gdelt.GDELTIngest            \
    -instanceId <accumulo-instance-id>               \
    -zookeepers <zookeeper-hosts-string>             \
    -user <username> -password <password>            \
    -auths <comma-separated-authorization-string>    \
    -tableName gdelt -featureName event              \
    -ingestFile hdfs:///gdelt/uncompressed/gdelt.tsv
Note that authorizations are optional. Unless you know that your table already exists with explicit authorizations, or that it will be created with default authorizations, you probably want to omit this parameter.
DataStore Initialization
GeoTools uses a SimpleFeatureType to
represent the schema for individual SimpleFeatures created from the
GDELT data. We can easily create a schema for the GDELT
SimpleFeatureType using the GeoTools DataUtilities
class.
The schema string is a comma separated list of attribute descriptors of
the form “:”, e.g. “Year:Integer”. Some attributes may have a third term
with an appended “hint”, e.g. “geom:Point:srid=4236”, and the default
geometry attribute is often prepended with an asterisk. For example, a
complete schema string for a SimpleFeatureType describing a city
with a latitude/longitude point, a name, and a population might be
“*geom:Point:srid=4326,cityname:String,population:Integer”.
This is how GDELTIngest.java creates the SimpleFeatureType for
the GDELT event data:
static List<String> attributes = Lists.newArrayList(
    "GLOBALEVENTID:Integer",
    "SQLDATE:Date",
    "MonthYear:Integer",
    "Year:Integer",
    "FractionDate:Float",
    //...
    "*geom:Point:srid=4326"
);
String spec = Joiner.on(",").join(attributes);
SimpleFeatureType featureType = DataUtilities.createType(name, spec);
After we create the GDELT feature type, we have to tell GeoMesa which
field to use for the date index. We specify this field using the
SimpleFeatureType’s user data.
// This tells GeoMesa to use this attribute as the indexed date field
featureType.getUserData().put(SimpleFeatureTypes.DEFAULT_DATE_KEY, "SQLDATE");
Finally, we create the new feature type in GeoMesa as follows.
ds.createSchema(featureType);
Mapper
In the setup method of the Mapper class, we create a
FeatureBuilder for the GDELT SimpleFeatureType we created in the
initialization.
String featureName = context.getConfiguration().get(GDELTIngest.FEATURE_NAME);
SimpleFeatureType featureType = GDELTIngest.buildGDELTFeatureType(featureName);
featureBuilder = new SimpleFeatureBuilder(featureType);
The input to the map method is a single line of the GDELT TSV file. We
split the line on tabs and extract the attributes of the data. We parse
the latitude and longitude field to set the default geometry of our
SimpleFeature.
GeoTools provides common conversions for most data types and some date
formats. However, any attribute strings that will not convert
automatically into the specified class need to be explicitly set on the
SimpleFeature. See “SQLDATE” below.
featureBuilder.reset();
featureBuilder.addAll(attributes);

Double lat = Double.parseDouble(attributes[LATITUDE_COL_IDX]);
Double lon = Double.parseDouble(attributes[LONGITUDE_COL_IDX]);
Geometry geom = geometryFactory.createPoint(new Coordinate(lon, lat));
SimpleFeature simpleFeature = featureBuilder.buildFeature(attributes[ID_COL_IDX]);
simpleFeature.setAttribute("SQLDATE", formatter.parse(attributes[DATE_COL_IDX]));
simpleFeature.setDefaultGeometry(geom);
We leverage the GeoMesaOutputFormat in order to write
SimpleFeatures to Accumulo. Once we have created the
SimpleFeature, all we have to do is write it to the output context:
context.write(new Text(), simpleFeature);
Analyze
GeoServer Setup
First, follow Installing GeoMesa Accumulo in GeoServer to set up the GeoMesa GeoServer plugin if you haven’t done so.
Register the GeoMesa DataStore with GeoServer
Click “Stores” and “Add new Store”. If you do not see the Accumulo Feature Data Store listed under Vector Data Sources, ensure the plugin is in the right directory and restart GeoServer.
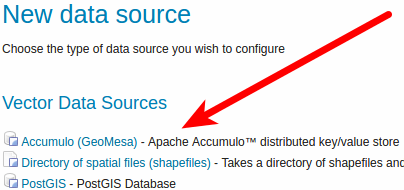
Registering new Data Store
Register the newly created Accumulo table using the same parameters specified in the command line above. (If you use a workspace:layer name other than “geomesa:gdelt”, you will need to change the WMS requests that follow.)
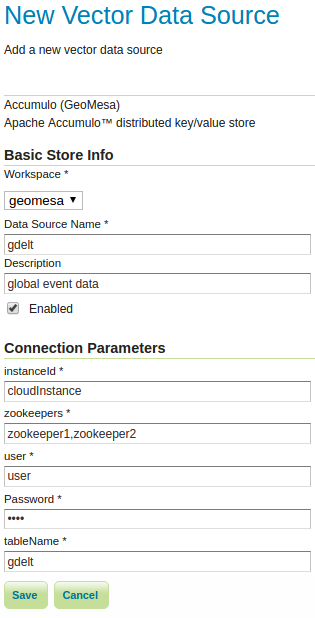
Registering new Accumulo Feature Data Store
Publish layer
After registering the DataStore, click to publish the layer. You will be taken to the Edit Layer screen. In the Data pane, enter values for the bounding boxes. For the whole world, use [-180,-90,180,90]. In the Dimensions pane, enable Time and select the SQLDATE field. You will also need to specify a presentation for time - use List as a default.
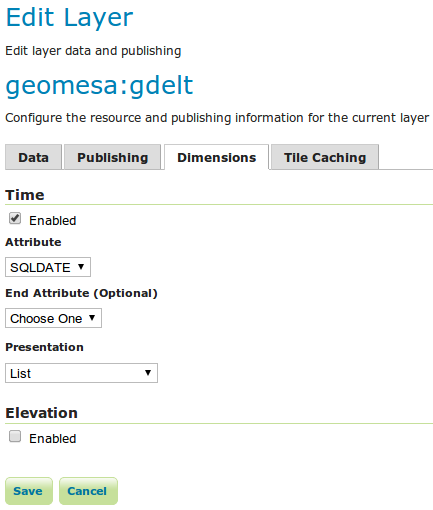
Enable Time for the Layer
Query
Let’s look at events in the Ukraine from 2013 until April 30, 2014. The red squares are the default styling that GeoServer applies to point data.
http://localhost:8080/geoserver/wms?service=WMS&version=1.1.0&request=GetMap&layers=geomesa:gdelt&styles=&bbox=31.6,44,37.4,47.75&width=1200&height=600&srs=EPSG:4326&format=application/openlayers&TIME=2013-01-01T00:00:00.000Z/2014-04-30T23:00:00.000Z
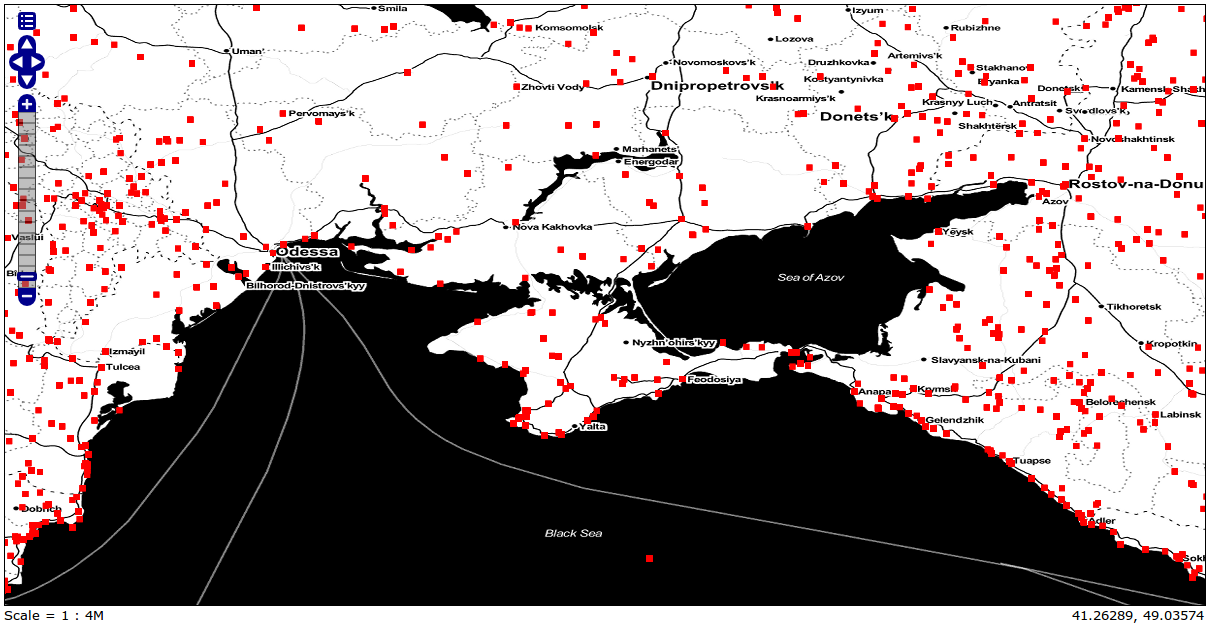
Showing all GDELT events from Jan 1, 2013 to April 30, 2014
The above map is using the Stamen Toner layer as a base layer. For more information about adding multiple layers into one group see the GeoServer documentation.
Filter
Let’s narrow our results. GDELT labels events with CAMEO (Conflict and Mediation Event Observations) codes. The CAMEO code for events of type ‘THREATEN’ starts with ‘13’. We can filter down to these events using the drop down in GeoServer’s OpenLayers preview.
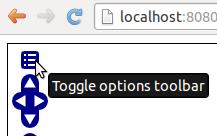
Open GeoServer Toggle Options Toolbar

Enter CQL Filter into Toolbar
Let’s use a custom icon to display THREATEN events, by adding an SLD
style to
the layer. Add the SLD file
threat.sld
to GeoServer (See the GeoServer documentation for more information
about adding SLD
files.
For the ExternalGraphic in the SLD to work, move the image file to the
specified location in your GeoServer installation.
http://localhost:8080/geoserver/wms?service=WMS&version=1.1.0&request=GetMap&layers=geomesa:gdelt&CQL_FILTER=EventRootCode=13&styles=threat&bbox=31.6,44,37.4,47.75&width=1200&height=600&srs=EPSG:4326&format=application/openlayers&TIME=2013-01-01T00:00:00.000Z/2014-04-30T23:00:00.000Z
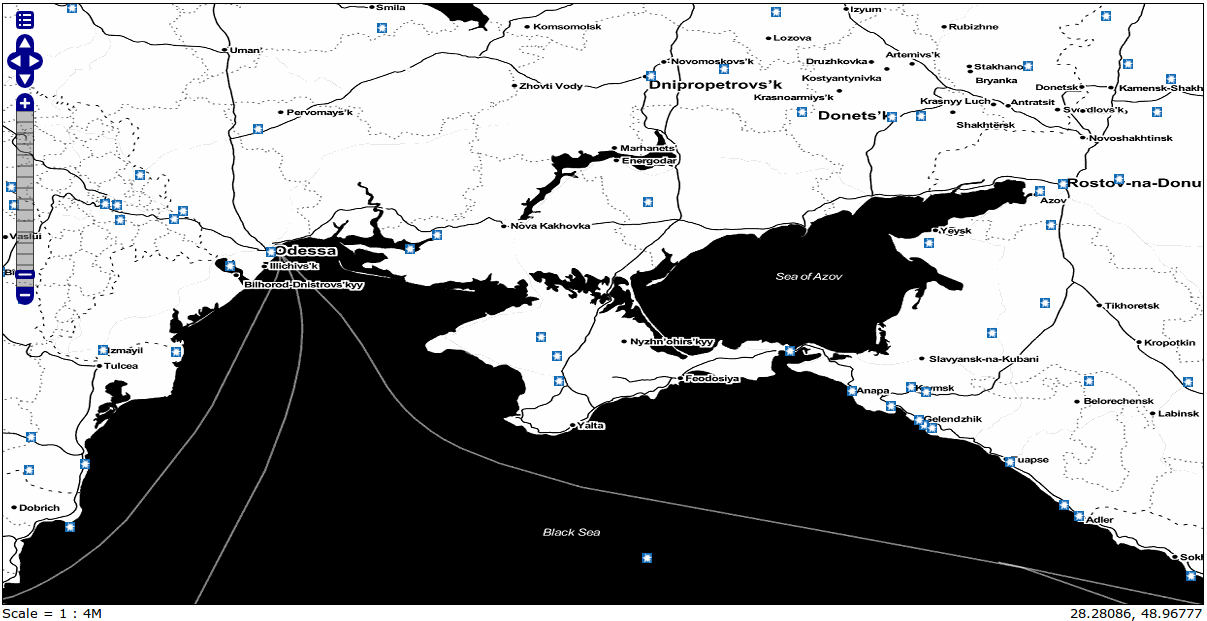
Showing GDELT events with CAMEO root code THREATEN from Jan 1, 2013 to April 30, 2014
Heatmaps
Use a heatmap to more clearly visualize multiple events in the same location or high volume of data in general.
Note
The heatmap style requires that geomesa-process-wps be installed in your
GeoServer, as described in GeoMesa Process.
Add the SLD file
heatmap.sld to
GeoServer.
In the request below, the heatmap is before the points layer so that the points will be overlaid and not hidden. Notice the “&env=radiusPixels:30” in the URL; this is SLD variable substitution, and will replace the default value assigned in the SLD.
http://localhost:8080/geoserver/wms?service=WMS&version=1.1.0&request=GetMap&layers=geomesa:gdelt,geomesa:gdelt&CQL_FILTER=include;EventRootCode=13&styles=heatmap,threat&bbox=31.6,44,37.4,47.75&width=1200&height=600&srs=EPSG:4326&format=application/openlayers&TIME=2013-01-01T00:00:00.000Z/2014-04-30T23:00:00.000Z&env=radiusPixels:30
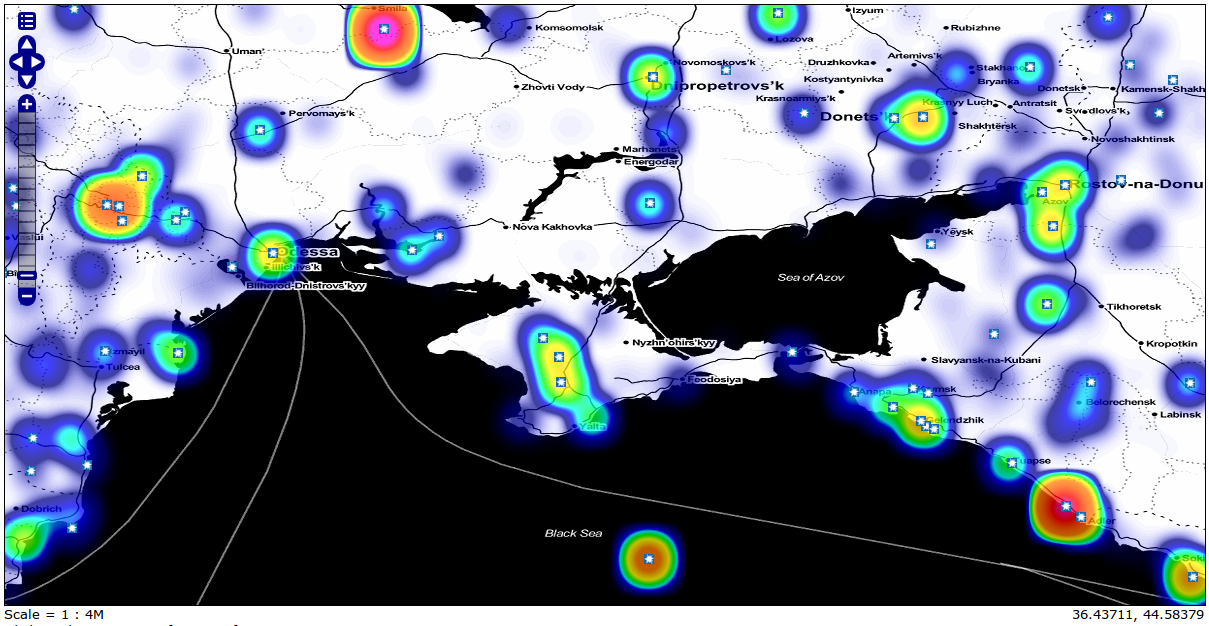
Showing heatmap with event overlay of GDELT events with CAMEO root code THREATEN from Jan 1, 2013 to April 30, 2014