GeoMesa NiFi Quick Start
This tutorial provides an example implementation for using GeoMesa with NiFi. This walk-through will guide you in setting up the components required for ingesting GDELT files into GeoMesa running on Accumulo.
Prerequisites
Before you begin, you must have the following:
- an instance of Accumulo 1.7 or 1.8 running on Hadoop 2.2 or better
- an Accumulo user that has both create-table and write permissions
- the GeoMesa Accumulo distributed runtime installed for your Accumulo instance
- a local copy of the Java JDK 8
- Apache Maven installed
- an instance of Apache NiFi 0.4.1 or better
- (Optional) an installation of GeoServer with the GeoMesa Accumulo GeoServer plugin to visualize the ingested data.
- a GitHub client installed
About this Tutorial
This QuickStart operates by reading csv files from /tmp/gdelt/ and
using the PutGeoMesa processor, ingests the files into GeoMesa running
on Accumulo.
Obtain GDELT data
In this QuickStart we will be ingesting GDELT data. If you already have some GDELT data available locally or previously ran the Map-Reduce Ingest of GDELT example then you may skip this section. Simply copy the data you have into /tmp/gdelt.
The GDELT Event database provides a
comprehensive time- and location-indexed archive of events reported in
broadcast, print, and web news media worldwide from 1979 to today. You
can download raw GDELT data files at
http://data.gdeltproject.org/events/index.html. For example, the
following Bash commands use wget to download all event files for
2013 (2 GB compressed, 14 GB uncompressed) and md5sum to verify each
by their MD5 hash:
$ mkdir /tmp/gdelt && cd /tmp/gdelt
$ wget http://data.gdeltproject.org/events/md5sums
$ for file in `cat md5sums | cut -d' ' -f3 | grep '^2013'` ; do wget http://data.gdeltproject.org/events/$file ; done
$ md5sum -c md5sums 2>&1 | grep '^2013'
$ unzip '*.zip'
Download and Build the GeoMesa NiFi project
Pick a reasonable directory on your machine, and run:
$ git clone https://github.com/geomesa/geomesa-nifi.git
$ cd geomesa-nifi
To build, run
$ mvn clean install
This will build three processors.
- PutGeoMesa - Ingest data into GeoMesa with a GeoMesa converter or from geoavro
- PutGeoTools - Ingest data into an arbitrary GeoTools Datastore based on parameters using a GeoMesa converter or avro
- ConvertToGeoAvro - Use a GeoMesa converter to create geoavro
However we will only be using the PutGeoMesa for this QuickStart.
Install the GeoMesa Processor
Install the GeoMesa NiFi Processor
In order to use NiFi with GeoMesa we need to first install the GeoMesa
processor. To do this simply copy the geomesa-nifi-nar-$VERSION.nar
that you just built from geomesa-nifi/geomesa-nifi-nar/target to the
lib/ directory of you NiFi installation.
Install the SFTs and Converters
Additionally we need to copy the geomesa-accumulo-$VERSION-data.jar
from the geomesa-accumulo-dist to the lib/ of the NiFi installation.
The geomesa-accumulo-$VERSION-data.jar is located in the
dist/sfts-converters directory of the geomesa-accumulo-dist. This
jar contains the sfts and converters needed for GeoMesa to ingest the
GDELT data. You can obtain the geomesa-accumulo-dist from
here
or you may build it locally if you have geomesa source available using:
$ mvn clean install -am -pl :geomesa-accumulo-dist_2.11
Upload the NiFi flow template
The NiFi template provided
here sets
up a basic NiFi flow from a GetFile processor to a PutGeoMesa processor.
To upload the NiFi template, download it to your local machine and in
NiFi select the Upload Template option in the Operate side
panel. After uploading the template you can add it to the workspace by
dragging the New Template option from the NiFi main header into the
workspace and selecting the template from the drop down. You will need
to configure the PutGeoMesa processor for your Accumulo Instance. Simply
edit the PutGeoMesa configuration and edit the following properties:
instanceIdYour Accumulo instance ID.zookeepersA comma separated list of zookeeper IPs or hostnames.userAccumulo username that has both create-table and write permissions.passwordPassword to above user.
Warning
If you have set up the GeoMesa Accumulo distributed
runtime to be isolated within a namespace as described in the
GeoMesa installation
guide,
the value of tableName should include the namespace (e.g.
myNamespace.gdelt).
Visualize Data With GeoServer
Register the GeoMesa store with GeoServer
Log into GeoServer using your user and password credentials. Click “Stores” and “Add new Store”. If you do not see the Accumulo Feature Data Store listed under Vector Data Sources, ensure the plugin is in the right directory and restart GeoServer.
Select the Accumulo Feature Data Store vector data source, and enter
the following parameters:
- basic store info
workspacethis is dependent upon your GeoServer installationdata source namepick a sensible name, such as,geomesa_nifi_quick_startdescriptionthis is strictly decorative;GeoMesa NiFi quick start- connection parameters
- these are the same parameter values that you supplied to the processor when you ran the tutorial; they describe how to connect to the Accumulo instance where your data resides.
Click “Save”, and GeoServer will search your Accumulo table for any GeoMesa-managed feature types.
Publish the layer
GeoServer should recognize the feature type, and should present that as a layer that could be published. Click on the “Publish” link.
You will be taken to the Edit Layer screen. Two of the tabs need to be updated: Data and Dimensions.
In the Data pane, enter values for the bounding boxes. In this case, you can click on the link to compute these values from the data.
In the Dimensions tab, check the “Enabled” checkbox under Time. Then select “When” in the Attribute and End Attribute dropdowns, and “Continuous Interval” in the Presentation dropdown.
Click on the “Save” button when you are done.
Take a look
Click on the “Layer Preview” link in the left-hand gutter. If you don’t see the quick-start layer on the first page of results, enter the name of the layer you just created into the search box, and press .
Once you see your layer, click on the “OpenLayers” link, which will open a new tab. By default, the display that opens will not show all the data, because we have enabled the time dimension for this layer, but the preview does not specify a time. In the URL bar for the visualization, add the following to the end:
&TIME=2014-01-01T00:00:00.000Z/2014-01-31T23:59:59.999Z
That tells GeoServer to display the records for the entire month of January 2014. You can find more information about the TIME parameter from GeoServer’s documentation.
Once you press , the display will update, and you should see a collection of red dots similar to the following image.
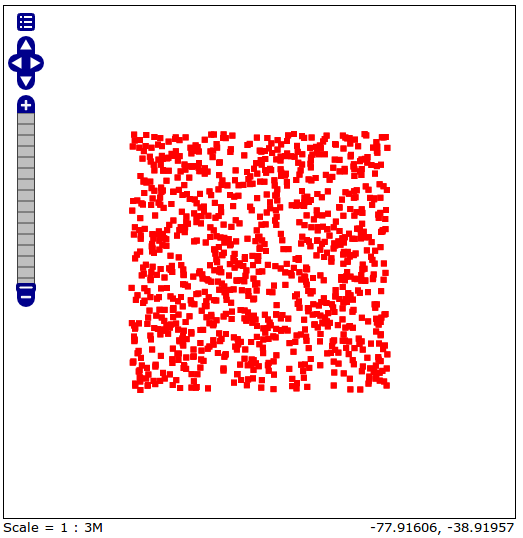
Visualizing quick-start data
Tweaking the display
Here are just a few simple ways you can play with the visualization:
- Click on one of the red points in the display, and GeoServer will report the detail records underneath the map area.
- Shift-click to highlight a region within the map that you would like to zoom into.
- Alter the
TIME=parameter in the URL to a different date range, and you can filter to see only the records that satisfy the temporal constraint. - Click on the “Toggle options toolbar” icon in the upper-left corner
of the preview window. The right-hand side of the screen will include
a “Filter” text box. Enter
Who = 'Bierce', and press on the “play” icon. The display will now show only those points matching your filter criterion. This is a CQL filter, which can be constructed in various ways to query our data. You can find more information about CQL from GeoServer’s CQL tutorial.
Generating Heatmaps
- To try out the DensityIterator, you can install the Heatmap SLD from the GDELT Tutorial.
- After configuring the SLD, in the URL, change
styles=to bestyles=heatmap&density=true. Once you press , the display will change to a density heat-map. (NB: For this to work, you will have to first install the WPS module for GeoServer. See the official web site for a download.)