GeoMesa Accumulo Quick Start
This tutorial is the fastest and easiest way to get started with GeoMesa. It is a good stepping-stone on the path to the other tutorials that present increasingly involved examples of how to use GeoMesa.
In the spirit of keeping things simple, the code in this tutorial only does a few small things:
- establishes a new (static) SimpleFeatureType
- prepares the Accumulo table to store this type of data
- creates a few hundred example SimpleFeatures
- writes these SimpleFeatures to the Accumulo table
- queries for a given geographic rectangle, time range, and attribute filter, writing out the entries in the result set
The only dynamic element in the tutorial is the Accumulo destination; that is a property that you provide on the command-line when running the code.
Prerequisites
Before you begin, you must have the following:
- an instance of Accumulo 1.7 or 1.8 running on Hadoop 2.2 or better,
- an Accumulo user that has both create-table and write permissions,
- the GeoMesa Accumulo distributed runtime installed for your Accumulo instance (see Installing the Accumulo Distributed Runtime Library ),
- a local copy of Java JDK 8,
- Apache Maven installed, and
- a GitHub client installed.
Download and Build the Tutorial
Pick a reasonable directory on your machine, and run:
$ git clone https://github.com/geomesa/geomesa-tutorials.git
$ cd geomesa-tutorials
Note
You may need to download a particular release of the tutorials project to target a particular GeoMesa release.
To build, run
$ mvn clean install -pl geomesa-quickstart-accumulo
Note
Ensure that the version of Accumulo, Hadoop, etc in
the root pom.xml match your environment.
Note
Depending on the version, you may also need to build GeoMesa locally. Instructions can be found here.
About this Tutorial
The QuickStart operates by inserting and then querying 1000 features. After the insertions are complete, a sequence of queries are run to demonstrate different types of queries possible via the GeoTools API.
Run the Tutorial
On the command-line, run:
$ java -cp geomesa-quickstart-accumulo/target/geomesa-quickstart-accumulo-${geomesa.version}.jar \
  com.example.geomesa.accumulo.AccumuloQuickStart \
  -instanceId <instance>                          \
  -zookeepers <zookeepers>                        \
  -user <user>                                    \
  -password <password>                            \
  -tableName <table>
where you provide the following arguments:
<instance>the name of your Accumulo instance<zookeepers>your Zookeeper nodes, separated by commas<user>the name of an Accumulo user that has permissions to create, read and write tables<password>the password for the previously-mentioned Accumulo user<table>the name of the destination table that will accept these test records; this table should either not exist or should be empty
Warning
If you have set up the GeoMesa Accumulo distributed
runtime to be isolated within a namespace (see
Namespace Install) the value of <table>
should include the namespace (e.g. myNamespace.geomesa).
The Accumulo QuickStart allows you to delete the created tables upon
successful completion of the QuickStart. Use the flag -deleteTables
without an argument to specify that the tables should be deleted.
You should see output similar to the following (not including some of Maven’s output and log4j’s warnings):
Creating feature-type (schema):  QuickStart
Creating new features
Inserting new features
Submitting query
1.  Bierce|640|Sun Sep 14 15:48:25 EDT 2014|POINT (-77.36222958792739 -37.13013846773835)|null
2.  Bierce|886|Tue Jul 22 14:12:36 EDT 2014|POINT (-76.59795732474399 -37.18420917493149)|null
3.  Bierce|925|Sun Aug 17 23:28:33 EDT 2014|POINT (-76.5621106573523 -37.34321201566148)|null
4.  Bierce|589|Sat Jul 05 02:02:15 EDT 2014|POINT (-76.88146600670152 -37.40156607152168)|null
5.  Bierce|394|Fri Aug 01 19:55:05 EDT 2014|POINT (-77.42555615743139 -37.26710898726304)|null
6.  Bierce|931|Fri Jul 04 18:25:38 EDT 2014|POINT (-76.51304097832912 -37.49406125975311)|null
7.  Bierce|322|Tue Jul 15 17:09:42 EDT 2014|POINT (-77.01760098223343 -37.30933767159561)|null
8.  Bierce|343|Wed Aug 06 04:59:22 EDT 2014|POINT (-76.66826220670282 -37.44503877750368)|null
9.  Bierce|259|Thu Aug 28 15:59:30 EDT 2014|POINT (-76.90122194030118 -37.148525741002466)|null
Submitting secondary index query
Feature ID Observation.859 | Who: Bierce
Feature ID Observation.355 | Who: Bierce
Feature ID Observation.940 | Who: Bierce
Feature ID Observation.631 | Who: Bierce
Feature ID Observation.817 | Who: Bierce
Submitting secondary index query with sorting (sorted by 'What' descending)
Feature ID Observation.999 | Who: Addams | What: 999
Feature ID Observation.996 | Who: Addams | What: 996
Feature ID Observation.993 | Who: Addams | What: 993
Feature ID Observation.990 | Who: Addams | What: 990
Feature ID Observation.987 | Who: Addams | What: 987
The quick start code may also be run via Maven using the live-test
profile:
$ mvn -Plive-test exec:exec -DinstanceId=<instance> -Dzookeepers=<zookeepers> -Duser=<user> -Dpassword=<password> -DtableName=<tableName>
Looking at the Code
The source code is meant to be accessible for this tutorial, but here is
a high-level breakdown of the methods in the AccumuloQuickStart
class that are relevant:
getCommonRequiredOptionshelper code to establish the command-line parser for Accumulo optionsgetAccumuloDataStoreConfcreate aHashMapof Accumulo parameters that will be used to fetch aDataStorecreateSimpleFeatureTypedefines the customFeatureTypeused in the tutorial. There are five fields: Who, What, When, Where, and Why.createNewFeaturescreates a collection of new features, each of which is initialized to some randomized set of valuesinsertFeaturesinstructs theDataStoreto write the collection of new features to the GeoMesa-managed Accumulo tablecreateFiltergiven a set of geometric bounds, temporal bounds, and an optional attribute-only expression, construct a common query language (CQL) filter that embodies these constraints. This filter will be used to query data.queryFeaturesquery for records; for each, print out the five field (attribute) valuessecondaryIndexExampleadditional examples that build other CQL queriesmainthis is the main entry point; it collects command-line parameters, builds theDataStore, creates and inserts new records, and then kicks off a single query
Visualize Data With GeoServer
Register the GeoMesa store with GeoServer
Log into GeoServer using your user and password credentials. Click “Stores” and “Add new Store”. If you do not see the Accumulo Feature Data Store listed under Vector Data Sources, ensure the plugin is in the right directory and restart GeoServer.
Select the Accumulo (GeoMesa) vector data source, and enter the
following parameters:
Basic store info:
workspacethis is dependent upon your GeoServer installationdata source namepick a sensible name, such as,geomesa_quick_startdescriptionthis is strictly decorative;GeoMesa quick start
Connection parameters:
- these are the same parameter values that you supplied on the command-line when you ran the tutorial; they describe how to connect to the Accumulo instance where your data reside
Click “Save”, and GeoServer will search your Accumulo table for any GeoMesa-managed feature types.
Publish the layer
GeoServer should recognize the AccumuloQuickStart feature type, and
should present that as a layer that could be published. Click on the
“Publish” link.
You will be taken to the Edit Layer screen. Two of the tabs need to be updated: Data and Dimensions.
In the Data pane, enter values for the bounding boxes. In this case, you can click on the link to compute these values from the data.
In the Dimensions tab, check the “Enabled” checkbox under Time. Then select “When” in the Attribute and End Attribute dropdowns, and “Continuous Interval” in the Presentation dropdown.
Click on the “Save” button when you are done.
Take a look
Click on the “Layer Preview” link in the left-hand gutter. If you don’t
see the quick-start layer on the first page of results, enter the name
of the layer you just created into the search box, and press
<Enter>.
Once you see your layer, click on the “OpenLayers” link, which will open a new tab. By default, the display that opens will not show all the data, because we have enabled the time dimension for this layer, but the preview does not specify a time. In the URL bar for the visualization, add the following to the end:
&TIME=2014-01-01T00:00:00.000Z/2014-01-31T23:59:59.999Z
That tells GeoServer to display the records for the entire month of January 2014. You can find more information about the TIME parameter from GeoServer’s documentation.
Once you press <Enter>, the display will update, and you should see
a collection of red dots similar to the following image.
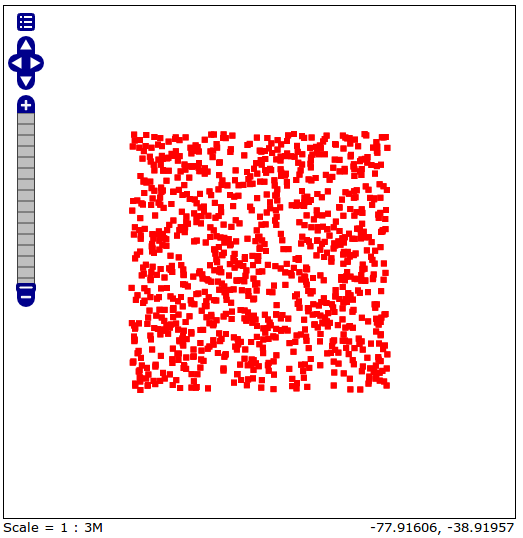
Visualizing quick-start data
Tweaking the display
Here are just a few simple ways you can play with the visualization:
- Click on one of the red points in the display, and GeoServer will report the detail records underneath the map area.
- Shift-click to highlight a region within the map that you would like to zoom into.
- Alter the
TIME=parameter in the URL to a different date range, and you can filter to see only the records that satisfy the temporal constraint. - Click on the “Toggle options toolbar” icon in the upper-left corner
of the preview window. The right-hand side of the screen will include
a “Filter” text box. Enter
Who = 'Bierce', and press on the “play” icon. The display will now show only those points matching your filter criterion. This is a CQL filter, which can be constructed in various ways to query our data. You can find more information about CQL from GeoServer’s CQL tutorial.
Generating Heatmaps
- To try out the DensityIterator, you can install the Heatmap SLD from the Map-Reduce Ingest of GDELT tutorial.
- After configuring the SLD, in the URL, change
styles=to bestyles=heatmap&density=true. Once you press<Enter>, the display will change to a density heat-map.
Note
For this to work, you will have to first install the WPS module for GeoServer as described in GeoServer Plugins.